customizable viz
The customizable_viz task generates visualizations from ocean
model outputs using configurable map projection, variable selection, and
plotting options. All visualizations are done on the native MPAS mesh using
[mosaic](https://github.com/E3SM-Project/mosaic)
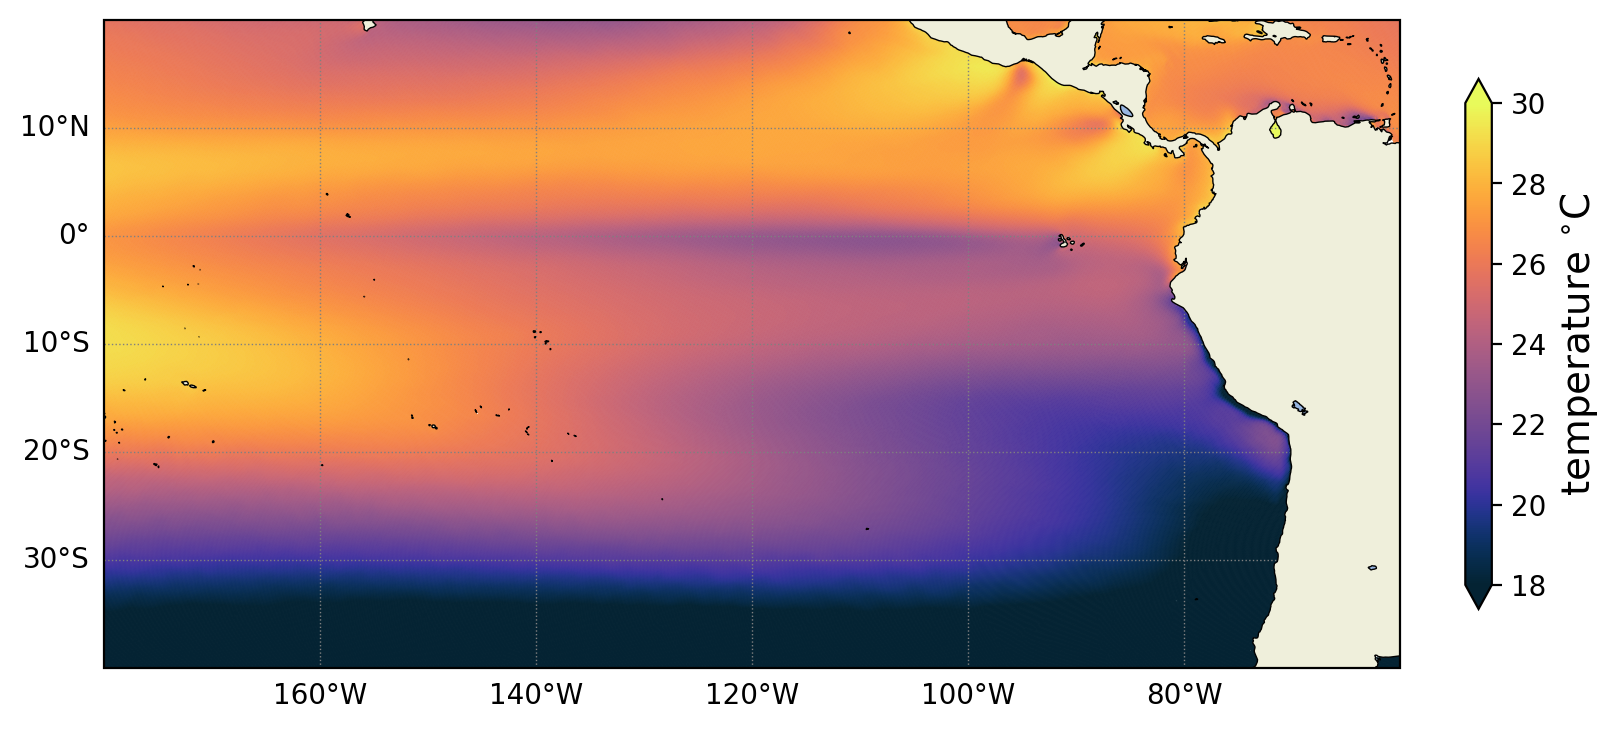
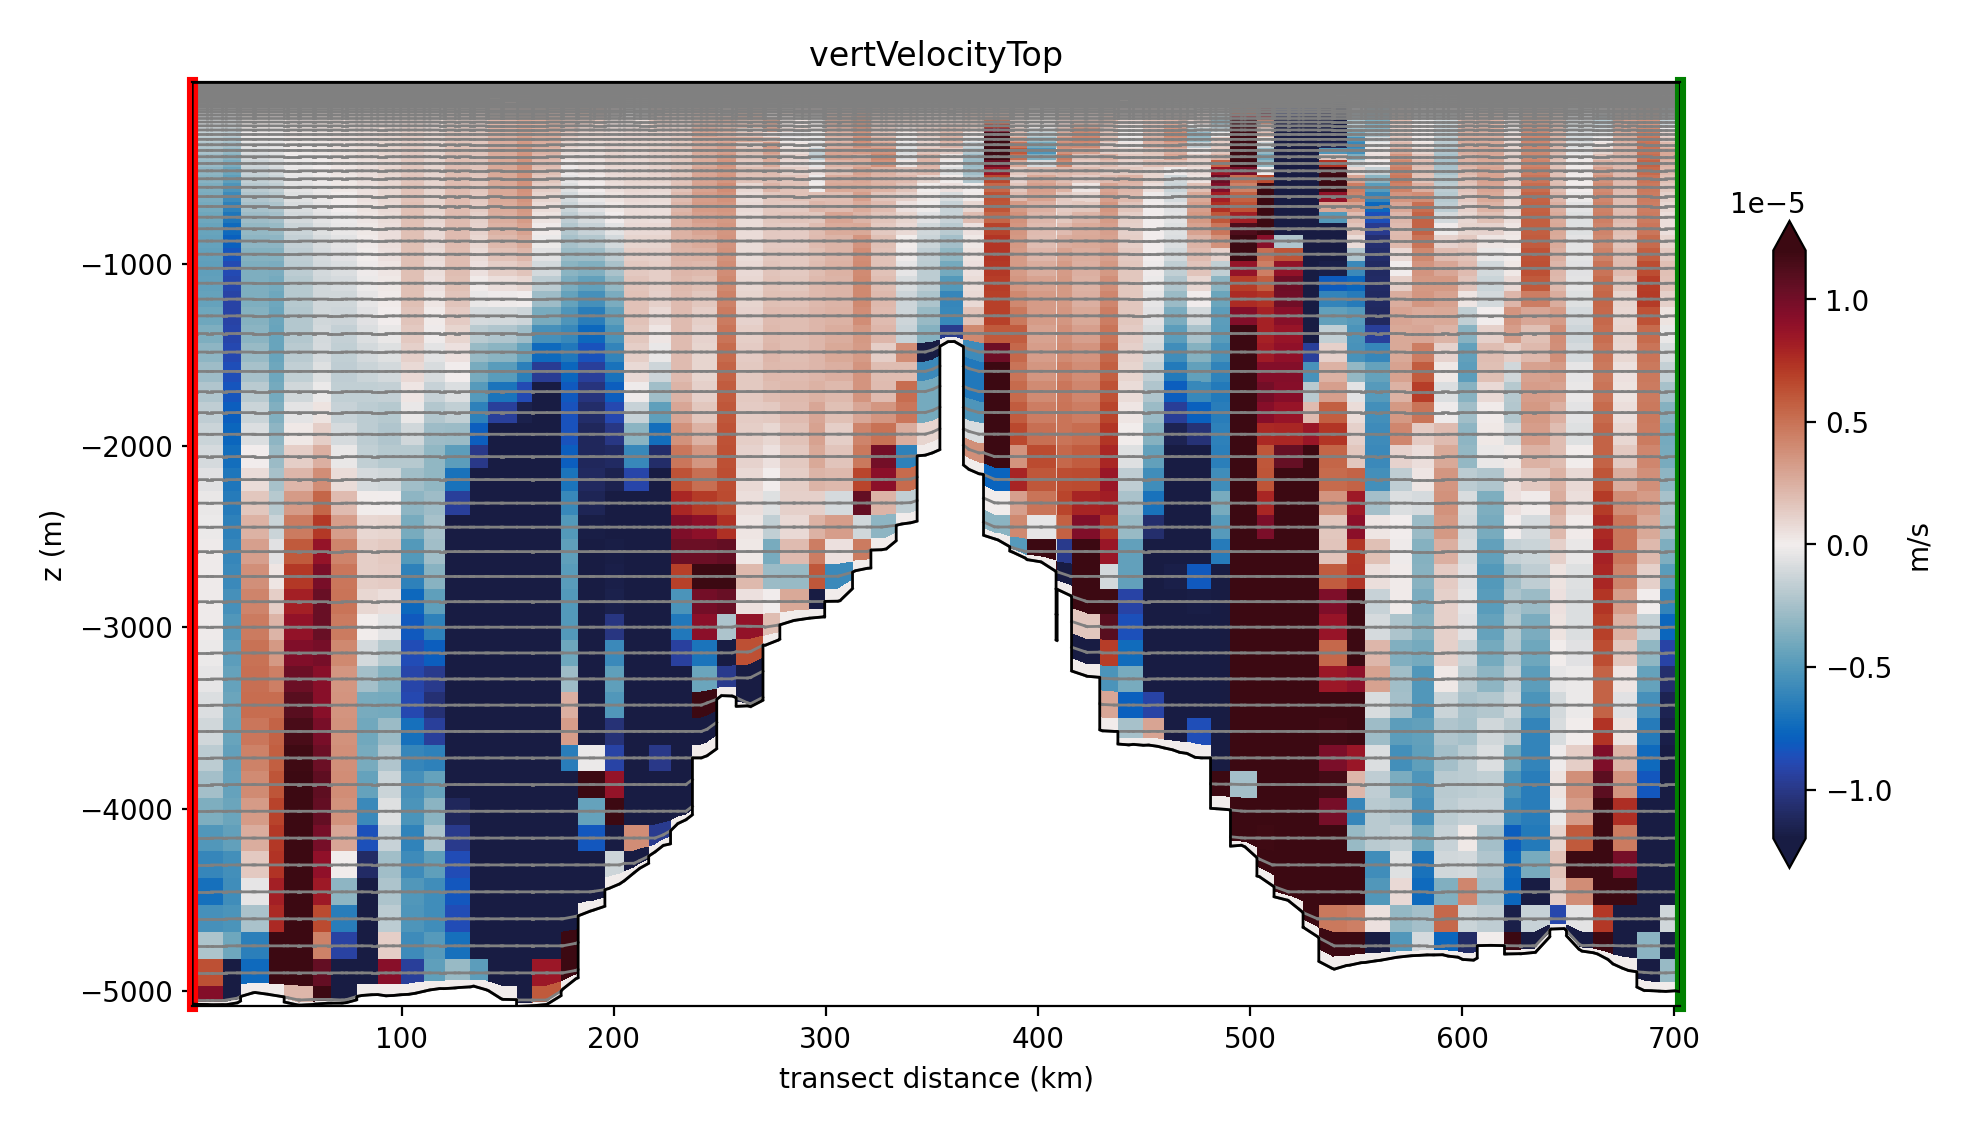
The customizable_viz task can produce plots of two types, horizontal field plots and vertical transect plots, from global MPAS fields.
suppported models
The task is designed to support output from global MPAS-Ocean or Omega simulations and netcdf files generated by MPAS-Analysis. It is likely extensible to MPAS-Seaice but this has not been tested.
mesh
The mesh file must be pre-generated and provided via a filepath in the config
option customizable_viz:mesh_filename. The mesh must be global.
vertical grid
There are no restrictions on the vertical grid specifications inherent to
the test case. The vertical_grid config section is not used.
Note that the vertical layer used for plotting a horizontal field will
correspond to the layer that has the closest mean z-mid value to the cfg
option customizable_viz_horiz_field:z_target.
initial conditions
If the user wants to plot an MPAS initial condition, it must be pregenerated
and the path to the file must be provided in cfg option customizable_viz:input_filename.
forcing
N/A
time step and run duration
N/A
config options
[customizable_viz]
# Mesh file, absolute file path
mesh_file =

# Data file, absolute file path
input_file =

# Transect file from viz_transect, optional
transect_file =

[customizable_viz_horiz_field]

# Projection to use for the horizontal field plot, must be supported by mosaic
projection = PlateCarree

# Fields to plot, comma-separated
variables = temperature, salinity

# Bounding box for the plot, global by default
min_latitude = -90

max_latitude = 90

min_longitude = 0

max_longitude = 360

# Optional: name of the colormap to use, including cmocean
#colormap_name = cmo.balance

# Optional: additional arguments to provide to the colormap norm
norm_args = {}

# Optional: colormap range is set in terms of percentile from
# colormap_range_percent to 100 - colormap_range_percent
#colormap_range_percent = 5

# the type of norm used in the colormap
norm_type = linear

# Note: for some projections, choosing a different central longitude may
# result in cells spanning the plot boundary
central_longitude = 180.

# The depth in m below the surface to use for layer selection
# Only one vertical level will be selected and its depth may vary
z_target = 0.

[customizable_viz_transect]

# Fields to plot, comma-separated
variables = temperature, salinity

# The start and end coordinates for the transect
# where x is longitude and y is latitude
x_start = -5.0
y_start = -65.0
x_end = 10.0
y_end = -65.0

# Optional: limits for colormap scaling
#vmin = None
#vmax = None

# Color to use for interfaces between vertical levels
layer_interface_color = None
Note that the config options listed in each step section will be used for all variables listed. For example, if a colormap cfg option is provided, all plots will use the same colormap. If the colormap is not provided, the colormaps derive from their defaults and may differ by variable.
cores
N/A