Adding a Visualization Step
We’ll add one more step to make some plots after the forward run has finished.
Here is the contents of viz.py:
$ vim polaris/tasks/ocean/my_overflow/viz.py
import cmocean  # noqa: F401
import numpy as np
import xarray as xr
from mpas_tools.ocean.viz.transect import compute_transect, plot_transect

from polaris import Step


class Viz(Step):
    """
    A step for plotting the results of the default overflow forward step
    """

    def __init__(self, component, init, forward, indir):
        """
        Create the step

        Parameters
        ----------
        component : polaris.Component
            The component the step belongs to

        init : polaris.tasks.ocean.my_overflow.init.Init
            the initial state step

        forward : polaris.tasks.ocean.my_overflow.forward.Forward
            the forward step

        indir : str
            the directory the step is in, to which ``name`` will be appended
        """
        super().__init__(component=component, name='viz', indir=indir)
        self.add_input_file(
            filename='mesh.nc', work_dir_target=f'{init.path}/culled_mesh.nc'
        )
        self.add_input_file(
            filename='init.nc', work_dir_target=f'{init.path}/init.nc'
        )
        self.add_input_file(
            filename='output.nc', work_dir_target=f'{forward.path}/output.nc'
        )

    def run(self):
        """
        Run this step of the task
        """
        ds_mesh = xr.load_dataset('mesh.nc')
        ds_init = xr.load_dataset('init.nc')
        ds = xr.load_dataset('output.nc')

        x_min = ds_mesh.xVertex.min().values
        x_max = ds_mesh.xVertex.max().values
        y_mid = ds_mesh.yCell.median().values

        x = xr.DataArray(data=np.linspace(x_min, x_max, 2), dims=('nPoints',))
        y = y_mid * xr.ones_like(x)

        ds_transect = compute_transect(
            x=x,
            y=y,
            ds_horiz_mesh=ds_mesh,
            layer_thickness=ds_init.layerThickness.isel(Time=0),
            bottom_depth=ds_init.bottomDepth,
            min_level_cell=ds_init.minLevelCell - 1,
            max_level_cell=ds_init.maxLevelCell - 1,
            spherical=False,
        )

        field_name = 'temperature'
        fields = {
            'initial': ds_init[field_name].isel(Time=0),
            'final': ds[field_name].isel(Time=-1)
        }

        for prefix, mpas_field in fields.items():

            plot_transect(
                ds_transect=ds_transect,
                mpas_field=mpas_field,
                title=f'{prefix} {field_name} at y={1e-3 * y_mid:.1f} km',
                out_filename=f'{prefix}_{field_name}_section.png',
                interface_color='grey',
                cmap='cmo.thermal',
                colorbar_label=r'$^\circ$C',
            )
It makes images showing transects of the initial and final temperature through
the middle of the domain. We add inputs in the contstuctor much as we did for
the forward step and we add transects plots similar to what we did in the
init step. Since these have been covered, we won’t go through them in
detail.
Adding the viz Step to the Task
We’re now ready to add the viz step to the default task:
$ vi ${POLARIS_HEAD}/polaris/ocean/tasks/yet_another_channel/default/__init__.py
from polaris import Task
from polaris.tasks.ocean.my_overflow.forward import Forward
from polaris.tasks.ocean.my_overflow.viz import Viz


class Default(Task):

    ...

    def __init__(self, test_group, resolution):

        ...

        self.add_step(forward_step)
        self.add_step(
            Viz(
                component=component,
                init=init,
                forward=forward_step,
                indir=self.subdir),
            run_by_default=False,
        )
Testing
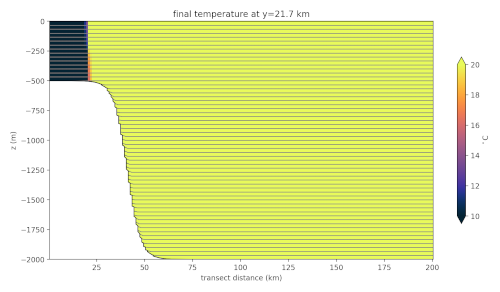
Overflow Temperature After 12 Minutes
And it’s time to test things out one more time, now with all 3 steps. Again, follow the procedure as in Testing the First Task and Step:
polaris listto make sure you can list the taskspolaris setupto set them up again (maybe in a fresh work directory)go to the task’s work directory
on an interactive node, run
polaris serial.
Since we added viz with run_by_default=False, it won’t run as part of the
default task (unless you edit the config options to add it to
steps_to_run). Instead, you will need to run it manually on its own:
cd viz
polaris serial